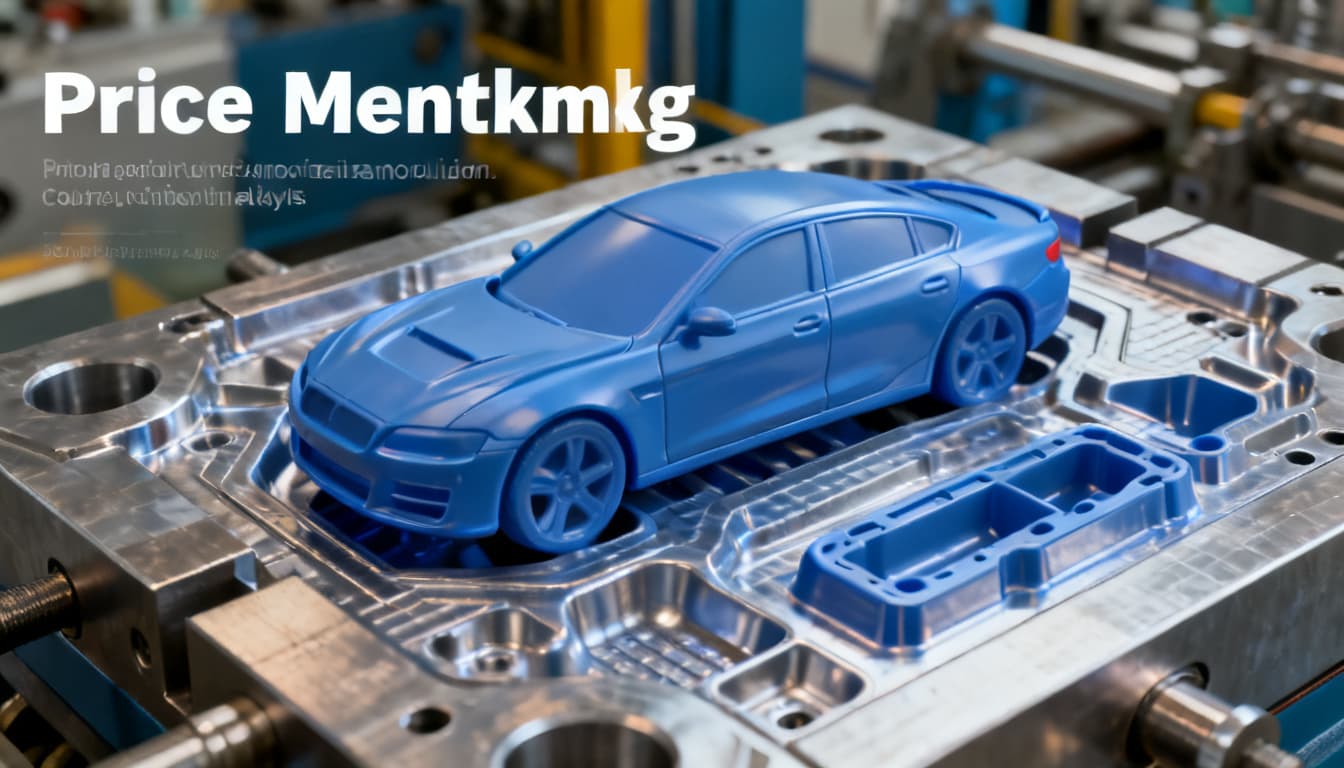
Automotive Injection Molding Partner Selection: 5 Cost-Modeling Techniques Engineers Use to Benchmark Piece-Price, Amortization, and Cavity Utilization
Automotive Tier-1 and OEM procurement teams operate under relentless pressure to shave fractions of a cent from every injection-molded component. A dashboard bracket quoted at $0.87 instead of $0.92 feels like a win—until that same bracket requires a mid-program tool rebuild, carries a 6.5-second cy
Why Piece-Price Alone Is Blind to Your Program's Real Cost Trajectory
Automotive Tier-1 and OEM procurement teams operate under relentless pressure to shave fractions of a cent from every injection-molded component. A dashboard bracket quoted at $0.87 instead of $0.92 feels like a win—until that same bracket requires a mid-program tool rebuild, carries a 6.5-second cycle time the supplier never validated, or runs in four cavities when eight would have slashed the per-part burden by 18%. The headline piece-price is seductive precisely because it collapses a complex manufacturing equation into a single, comparable number. It also conceals the three variables that actually determine whether your program bleeds margin or builds it: tooling amortization structure, cavity utilization efficiency, and lifecycle cost accumulation.
The automotive injection molding sector has undergone a quiet transformation in the last five years. Machine technology—documented extensively by Plastics Technology—has shifted toward all-electric platforms with tighter repeatability and energy consumption profiles that alter machine-hour rate calculations. Engineering-grade resins like glass-filled PA66 and PBT have seen supply volatility that renders last year's material cost assumptions obsolete. In this environment, a supplier who quotes an aggressive piece-price but buries tooling amortization in a front-loaded schedule, or one who assumes 95% cavity utilization when your part geometry and runner balance realistically yield 88%, has handed you a number that looks good on a spreadsheet and performs poorly on a P&L.
Key Takeaway: Piece-price is a snapshot. Program cost is a film reel. The five techniques that follow give you the projector—a structured way to benchmark, challenge, and ultimately trust the numbers that underpin your automotive molding partnerships.
The Five Cost-Modeling Levers Every Engineer Must Pull
Cost modeling for automotive injection molding is not a single calculation but a coordinated pull of five interdependent levers. Each lever exposes a different layer of cost reality, and skipping any one of them leaves enough blind spots for a supplier's pricing assumptions to drift unchecked across a 5- to 7-year program lifespan. Below are the five techniques, the practical formulas or rules of thumb that drive them, and the way they interconnect.
1. Amortization Schedule Reconciliation
Tooling cost—often a $60,000 to $350,000 line item for automotive molds—must be spread across the program's total expected volume. The trap is front-loading: a supplier who allocates 40% of tooling cost to the first production year creates an artificially low piece-price that balloons in years three through five when the program is too embedded to re-source. The corrective technique is to request a year-by-year amortization table and cross-check it against the program's contracted annual volume projections. The formula is straightforward:
Amortized Tooling Cost per Part = Total Tooling Cost ÷ Program Lifetime Volume
If the supplier's quoted amortization component diverges more than 12–15% from this straight-line baseline without a documented rationale (e.g., accelerated depreciation due to abrasive resin fillers that reduce mold life), treat it as a negotiation point.
2. Cavity Utilization & Efficiency Analysis
Cavity utilization measures what percentage of your mold's potential output actually translates into shippable parts. A 4-cavity mold running at 92% utilization produces effectively 3.68 cavities' worth of good parts per cycle. The gap—those 0.32 cavities lost to shorts, flash, or ejection issues—is real cost. The rule of thumb for automotive programs: every percentage point of cavity utilization lost above 5% from the theoretical maximum adds roughly 0.8–1.2% to the effective piece-price once you account for cycle time consumed by rejected shots.
3. Material Cost & Scrap Rate Modeling
Resin pricing is the largest single cost driver in most automotive molding programs, typically representing 45–60% of total part cost. The modeling technique here is to break material cost into three buckets: (a) the part net weight at the quoted resin price per kilogram, (b) the runner and sprue weight amortized across the cavity count, and (c) the scrap rate—both startup purge material and in-process rejects. A supplier quoting 1.5% scrap on a glass-filled nylon part with a hot-runner system may be plausible; one quoting 0.5% scrap on a cold-runner multi-cavity tool running POM probably isn't.
4. Cycle Time & Machine Rate Mapping
Cycle time multiplied by the machine-hour rate yields the conversion cost per part. The modeling technique requires validating both halves of that equation independently. Machine-hour rates in automotive molding typically range from $35 to $85 depending on press tonnage, geographic region, and whether the cell includes automation. Cycle time should be traceable to a Moldflow simulation or a documented time study—not a supplier's optimistic estimate. Even 2 seconds of unvalidated cycle time savings on a 500,000-part annual volume program misstates per-part cost by 8–12%.
5. Secondary & Logistics Cost Integration
Automotive parts rarely ship straight from the press. They require degating, annealing (for certain under-hood PA66 components), ultrasonic welding of inserts, clip installation, or anti-static packaging for Class-A interior surfaces. Each secondary operation carries labor, equipment amortization, and quality-inspection overhead. Logistics costs—especially for cross-border programs involving Mexico, Canada, or trans-Pacific shipping—should be modeled as a per-part line item with fuel surcharge assumptions stated explicitly.
Below, the five levers are mapped against their individual and combined impact on true part cost for a representative automotive interior trim component:
| Cost-Modeling Lever | Formula / Rule of Thumb | Typical Impact on True Part Cost | Validation Method |
|---|---|---|---|
| Amortization Schedule | Total Tool Cost ÷ Program Volume | 5–12% of piece-price (varies by volume) | Year-by-year amortization table vs. straight-line baseline |
| Cavity Utilization | Actual Good Parts ÷ (Cavities × Cycles) | 0.8–1.2% cost increase per % utilization lost below 95% | Production run data or time-study observation |
| Material & Scrap Rate | (Net Wt + Runner/Cav) × Resin $/kg × (1 + Scrap %) | 45–60% of total part cost; scrap adds 1–4% | Resin supplier quote + MRF yield reports |
| Cycle Time & Machine Rate | (Cycle Time × Machine Rate) ÷ (3600 × Cavities × Utilization) | 25–35% of total part cost | Moldflow simulation or independent time study |
| Secondary & Logistics | Sum of per-part secondary labor + freight + packaging | 8–18% of total part cost (highly part-specific) | Packed-part weight, shipping lane quote, secondary workstation cycle |
What the table above reveals is that no single lever dominates in isolation. A program with aggressive cycle-time assumptions but sloppy cavity utilization tracking can appear cost-competitive on paper while delivering per-part costs 10–15% above the modeled target. Engineers who model all five levers catch the interaction effects that piece-price comparisons systematically miss.
Should-Cost Models vs. Supplier-Bid Breakdowns: Where the Gaps Surface
Should-cost modeling—building a bottom-up estimate from resin pricing, machine rates, cycle times, and labor—serves as an engineer's compass. It tells you what the part should cost in a reasonably efficient operation. Supplier-bid breakdowns tell you what a specific molder wants to charge. The gap between the two maps directly to the supplier's overhead allocation philosophy, profit expectations, cavity-number assumptions, and how they've priced risk into the program. Automotive buyers who understand these gaps can negotiate with precision rather than simply pushing for an across-the-board discount.
The comparison table below examines four typical automotive component scenarios—interior trim, under-hood structural brackets, electrical connector housings, and exterior badging—and identifies where should-cost and supplier-bid figures commonly diverge:
| Automotive Component Scenario | Engineer Should-Cost Estimate (Typical Range) | Supplier-Bid Breakdown (Common Quote Structures) | Key Gap Drivers & Negotiation Leverage Points |
|---|---|---|---|
| Interior Trim (e.g., door panel insert, PC/ABS) | $0.95–$1.35 per part at 250k/year; assumes 2-cavity tool, 28s cycle, 2.5% scrap | $0.82–$1.10 per part; often quotes 4-cavity tool but doesn't validate cavity utilization; buries tool maintenance in overhead | Cavity-count mismatch between quote and actual tool plan; overhead allocation for Class-A surface inspection often understated. Request per-cavity yield data from similar tools. |
| Under-Hood Bracket (glass-filled PA66, structural) | $2.10–$2.80 per part at 120k/year; assumes single-cavity, 42s cycle, 3% scrap, post-mold annealing | $1.95–$2.40 per part; may omit annealing cost line item; material pricing based on virgin resin only—no regrind policy stated | Annealing secondary cost is a frequent gap; verify regrind percentage (glass-filled PA66 typically allows 15–20% regrind without property degradation). Check if supplier's resin quote reflects current Plastics Technology market pricing. |
| Electrical Connector Housing (PBT, tight tolerance) | $0.35–$0.55 per part at 800k/year; assumes 8-cavity hot-runner, 14s cycle, 1.5% scrap | $0.28–$0.42 per part; may assume 12-cavity tool without justifying runner balance; machine rate for smaller press than geometry requires | Runner balance across 8+ cavities with PBT is challenging—request Moldflow verification. A 12-cavity quote with unsubstantiated balance claims masks 3–5% yield loss. |
| Exterior Badging (chrome-plated ABS, decorative) | $1.60–$2.20 per part at 180k/year; assumes 2-cavity, 32s cycle, electroplating secondary at $0.40/part | $1.45–$1.85 per part; electroplating subcontracted—quoted as pass-through with no quality-inspection allocation; packaging cost often missing | Plating subcontractor yield losses and freight between molder and plater are classic gap areas. Packaging for chrome-plated parts (individual compartment trays) adds $0.08–$0.15/part that quotes frequently omit. |
Across all four scenarios, the pattern is consistent: supplier bids that appear 8–18% below should-cost estimates achieve that gap not through genuine efficiency advantages but through optimistic assumptions about cavity utilization, secondary operations, and quality-related overhead. The engineer who runs a disciplined should-cost model can isolate these gaps line by line and convert what would be a vague price negotiation into a technical conversation backed by data.
From Spreadsheet to RFQ: A Field-Tested Process for Cost-Based Partner Vetting
Building the five cost-modeling levers into an RFQ process transforms supplier selection from a bid-collection exercise into a structured, data-driven vetting workflow. The goal is not to eliminate supplier judgment—experienced molders bring process knowledge that no spreadsheet captures—but to make every assumption visible, comparable, and challengeable before tool steel is cut.
The following process has been refined across dozens of automotive programs and can be adapted to any component category:
- Pre-RFQ Should-Cost Baseline: Before soliciting bids, build an internal should-cost model using the five-lever framework. Populate it with current resin pricing (validated against supplier quotes or resin distributor data), realistic cycle times (ideally from a preliminary Moldflow analysis or part-similarity benchmarking), and machine-hour rates appropriate to the geographic region where you expect the mold to run. This baseline is your compass—without it, you're evaluating supplier bids in a vacuum.
- Structured Cost-Breakdown Template in the RFQ: Do not accept a single-line piece-price quote. Require every bidder to complete a standardized cost-breakdown template that separates: (a) material cost with resin grade, net weight, runner weight, and scrap rate stated; (b) cycle time with cooling, injection, and ejection segments broken out; (c) machine tonnage and hourly rate; (d) tooling cost with a year-by-year amortization table; (e) secondary operations itemized with per-part labor and equipment cost; (f) packaging and logistics with freight lane and fuel surcharge assumptions.
- Cavity-Utilization Validation: For multi-cavity tools, require bidders to submit evidence of cavity utilization from a comparable tool in production. A supplier running a similar 8-cavity PBT connector housing tool at 94% utilization has earned the right to assume that figure. One running at 86% but quoting 94% has not.
- Cycle-Time Audit Clause: Build into the RFQ the requirement that quoted cycle times be validated within the first 90 days of production via a mutually witnessed time study. This clause alone eliminates the incentive for suppliers to quote aggressive cycle times they cannot sustain.
- Amortization Schedule Alignment: Compare each bidder's amortization schedule—year by year—against your program's volume forecast. Flag any front-loaded schedule that concentrates more than 30% of total tooling amortization in year one, unless there is a documented justification (e.g., high-wear resin requiring mold refurbishment within 18 months).
- Overhead Normalization: Extract the supplier's machine-hour rate and indirect labor allocation from each bid. Normalize these across bidders using a consistent burdened-rate assumption for the region, so you're comparing controllable elements—material efficiency, cycle time, cavity strategy—rather than differences in how suppliers allocate corporate overhead across programs.
What does transparent, engineer-friendly cost disclosure look like in practice? Industry leaders and specialized molders—including firms like Panda Molding, whose engineering teams regularly engage with automotive buyers on cost-modeling discussions—demonstrate that a collaborative approach to cost transparency produces more durable partnerships. When a molder shares Moldflow-derived cycle time data, cavity-fill analysis, and a clear amortization philosophy at the RFQ stage, it signals that the relationship will be built on engineering alignment rather than price obfuscation. For programs seeking this level of cost visibility, starting a technical discussion early sets the right foundation.
The table below provides a practical RFQ data-request framework that maps directly to the five cost-modeling levers:
| RFQ Data Category | What to Request from Each Bidder | Red Flags in Supplier Responses | Verification Method |
|---|---|---|---|
| Tooling & Amortization | Total tool cost by component (cavity, core, base, hot-runner); year-by-year amortization table; steel type and expected mold life in shots | Single-line tool cost with no breakdown; amortization concentrated in year 1; no steel specification provided | Cross-check against SPI mold-class guidelines; compare amortization schedule with program volume forecast |
| Material & Scrap | Resin grade, supplier, and current $/kg; part net weight; runner/sprue weight per shot; regrind percentage; scrap rate assumption | Scrap rate below 1% for cold-runner tools; no regrind policy stated for engineering resins; material pricing not refreshed within 60 days | Request resin supplier quote directly; audit scrap rate from production data on similar tools |
| Cycle Time & Machine | Cycle breakdown (injection, cooling, ejection times); machine tonnage; machine-hour rate; energy cost allocation | Cooling time shorter than part-thickness and material thermal properties would predict; machine rate more than 20% below regional average | Moldflow cooling simulation; Plastics Technology machine-rate benchmarking data |
| Cavity Strategy | Proposed cavity count; runner balance analysis (for >4 cavities); expected cavity utilization percentage; evidence from similar tools | Cavity count inconsistent with quoted cycle time and annual volume; no runner-balance documentation for 8+ cavities; utilization claimed >97% without evidence | Demand Moldflow fill analysis for multi-cavity tools; request production yield data from comparable existing tools |
| Secondary & Logistics | Itemized secondary operations with cycle time per station; packaging specification and per-part cost; freight lane, mode, and fuel surcharge assumption | Secondary costs grouped as single lump sum; no packaging cost line item (common for cosmetic parts); freight cost quoted without lane or surcharge assumptions | Request subcontractor quotes for secondary ops; validate freight cost against spot-rate benchmarks for the lane |
The six-step process and RFQ framework above require more upfront effort than a simple three-bid comparison. But the return on that effort—in the form of cost assumptions that hold across the program lifespan rather than unraveling 18 months into production—consistently justifies the investment for automotive programs with annual volumes exceeding 100,000 parts.
Cost-Modeling Questions Senior Engineers Ask Before Awarding a Tooling PO
Below are the six questions that surface most frequently when engineering and procurement leads apply the five cost-modeling techniques to real automotive programs. Each answer is grounded in the practical mechanics of injection molding cost structures, not textbook definitions.
Q: How can I verify a molder's quoted amortization schedule for a multi-year automotive program?
Cross-check the total tooling cost against the expected part volume and program lifespan. Request a year-by-year amortization table—not a single blended figure—and compare the implied cost per part with industry benchmarks for similar mold classes and steel types. An automotive Class 101 mold (expected 1 million+ cycles) amortized over 3 years when the program runs 7 years is a red flag. Ask the molder to reconcile any deviation greater than 12–15% from a straight-line amortization schedule. If the justification is accelerated wear due to abrasive fillers, request the mold-life data or tooling warranty terms that support that assumption.
Q: When is it truly worth investing in higher cavity count tooling?
Calculate the break-even point by comparing the tooling upcharge against the reduced cycle-time burden and per-part cost. For high-volume automotive programs—typically above 500,000 parts per year—moving from 4 to 8 cavities can lower per-part cost enough to recover the additional tooling investment within 12–18 months. The math only works if press capacity is available (an 8-cavity mold requires higher clamp tonnage and potentially a larger platen) and runner balance is demonstrated—an unbalanced 8-cavity tool that runs at 85% utilization delivers only marginally better economics than a balanced 4-cavity tool at 94% utilization. Always run the cavity-utilization-adjusted comparison, not the theoretical-maximum comparison.
Q: What cycle time assumptions should I challenge in a supplier's cost model?
Focus on cooling time, which typically represents 50–70% of the total cycle. Optimistic suppliers often quote cooling times that ignore part thickness effects or material-specific solidification data. A 3mm-wall PA66 part with glass fiber loading requires materially longer cooling than a 2mm unfilled PP part—if both are quoted with identical cooling-to-injection-time ratios, one of those quotes is wrong. Request a time study from a comparable production tool or a Moldflow-based cooling simulation. Even 2–3 seconds of unvalidated cycle-time savings can skew per-part cost by 8–15% in programs running 500,000+ parts annually.
Q: How do regional labor and overhead rates warp cost comparisons between molding partners?
Two suppliers in different regions—say, one in the U.S. Midwest and one in Western Mexico—may quote identical material costs and cycle times but apply vastly different machine-hour rates and indirect labor allocations. The U.S. supplier might burden a 300-ton press at $65/hour while the Mexican counterpart burdens the same class of press at $38/hour, with the difference stemming from labor rates, facility overhead allocation philosophy, and energy costs rather than any efficiency advantage. To normalize the comparison, separate each quote into direct costs (material, cycle-time-driven conversion, ancillary equipment) and burdened overhead, then compare only the controllable elements. This prevents a supplier with aggressive overhead allocation from appearing uncompetitive when their actual manufacturing efficiency is superior.
Q: Can a should-cost model replace the RFQ process, or is it just a negotiation check?
A should-cost model is a powerful benchmarking tool—it is not a substitute for competitive bids. Even the most meticulously constructed model cannot capture a specific molder's proprietary process efficiencies, their unique tooling partnerships, or their current capacity-utilization strategy (a molder running at 65% capacity may price aggressively to fill presses in ways no model predicts). The should-cost model serves its highest purpose as an outlier-detection and negotiation-enablement tool: it tells you when a bid is 20% above or below the expected range and gives you the line-item detail to ask specific, technical questions rather than demanding generic price concessions. Final pricing must reflect actual market conditions, resin-supplier quotes, and the molder's demonstrated capabilities—none of which a model fully replaces.
Q: What red flags should engineers look for in a piece-price breakdown?
Five specific signals warrant immediate follow-up. First, a scrap rate quoted below 1% for a cold-runner tool running engineering resin—achievable in some high-precision environments but rare enough to demand production data evidence. Second, missing secondary-operation costs: if the part requires degating, annealing, insert installation, or plating and those line items are absent or rolled into a single overhead figure, the quoted piece-price is incomplete. Third, zero allocation for maintenance or quality inspection—automotive molds require preventative maintenance and dimensional inspection that carry real per-part cost; a quote that doesn't account for these assumes risk that will eventually land on your program's budget. Fourth, cavity counts inconsistent between the quote's piece-price calculation and the proposed tool plan—if the piece-price math assumes 8 cavities but the tooling section describes a 4-cavity mold, at least one of those numbers is wrong. Fifth, material pricing that hasn't been refreshed within 60 days for resins with volatile supply chains (PA66, PBT, PC). If the supplier cannot validate that their resin cost basis is current, assume it will be renegotiated upward before the first production shipment.
None of these red flags automatically disqualifies a supplier. But each one represents a cost assumption that, if left unchallenged, can silently inflate your program's total cost by 5–15% over its lifecycle. The purpose of the five cost-modeling techniques is to surface these assumptions early—when you still have the leverage to correct them.
References & Further Reading
- Plastics Technology — Injection molding industry news, machine technology trends, and resin pricing analysis relevant to automotive molding cost modeling.
- Plastics Technology — Injection Molding Topic Center — Technical articles on cycle-time optimization, cavity-balance validation, and machine-rate benchmarking.
- Panda Molding — Professional injection molding services with engineering-led cost transparency for automotive programs.
- Panda Molding — Contact & Technical Inquiry — Start a cost-modeling discussion with an engineering team experienced in automotive injection molding partnerships.
- Plastics Industry Association — Industry benchmarks, market data, and standards relevant to automotive plastics manufacturing economics.
- ASTM International — Material specification standards (ASTM D638, D790, D256) that underpin resin selection and mechanical property validation in automotive should-cost models.
- ISO — Quality management and process-control standards (ISO 9001, IATF 16949) that influence overhead cost structures in automotive molding supplier bids.
Conclusion
The five cost-modeling techniques described above—amortization schedule reconciliation, cavity utilization analysis, material and scrap rate modeling, cycle time and machine rate mapping, and secondary plus logistics cost integration—form a coherent framework that transforms automotive injection molding partner selection from a price-comparison exercise into an engineering discipline. The immediate payoff is negotiating leverage: when you can isolate a supplier's optimistic cavity-utilization assumption or an unvalidated cooling-time claim, you negotiate from data rather than from position. The longer-term payoff is program durability. Cost assumptions that are pressure-tested before tooling PO issuance hold across the production lifespan. Those that aren't—the piece-price-only numbers that look good in a procurement spreadsheet—tend to unravel exactly when re-sourcing becomes impossible. For automotive engineering and procurement teams ready to move beyond surface-level bid comparisons, engaging a technically transparent molding partner is the logical next step toward building a cost model that reflects reality rather than optimism.